
Heikin-Ashi Charts are a type of candlestick chart
They look at the high-low range over a certain period of time. The heiken ashi is Japanese for the "average price." Change in close patterns can be used to spot possible trends. Heikin-Ashi charts have an increased sensitivity to changes in the market direction, and are less affected by volatility than other types of charts. It is one of the most popular patterns that traders trade because it is visually easy and easy to read.
Heikin-Ashi Charts are widely used by those who trade based on trend in a market. In that case, a setup for an uptrend or downtrend set-up is required, where the price increases or decreases to create a gap in the Heikin-Ashi Pattern. A good example of a Heikin-Ashi Set-up is the number of candles that must occur before the price closes above or below a previously higher or lower closing price.
Heikin Ashi Charts are also used to identify important support and resistance areas.
You must always keep in mind that these patterns are only meant to give traders ideas on where possible support or resistance is forming. The trader must not fall into the trap of believing that these patterns form actual support/resistance. Trade your own ideas and keep with what you feel is right for you, not what an indicator is telling you.
Looking for reversals with Heiken Ashi charts.
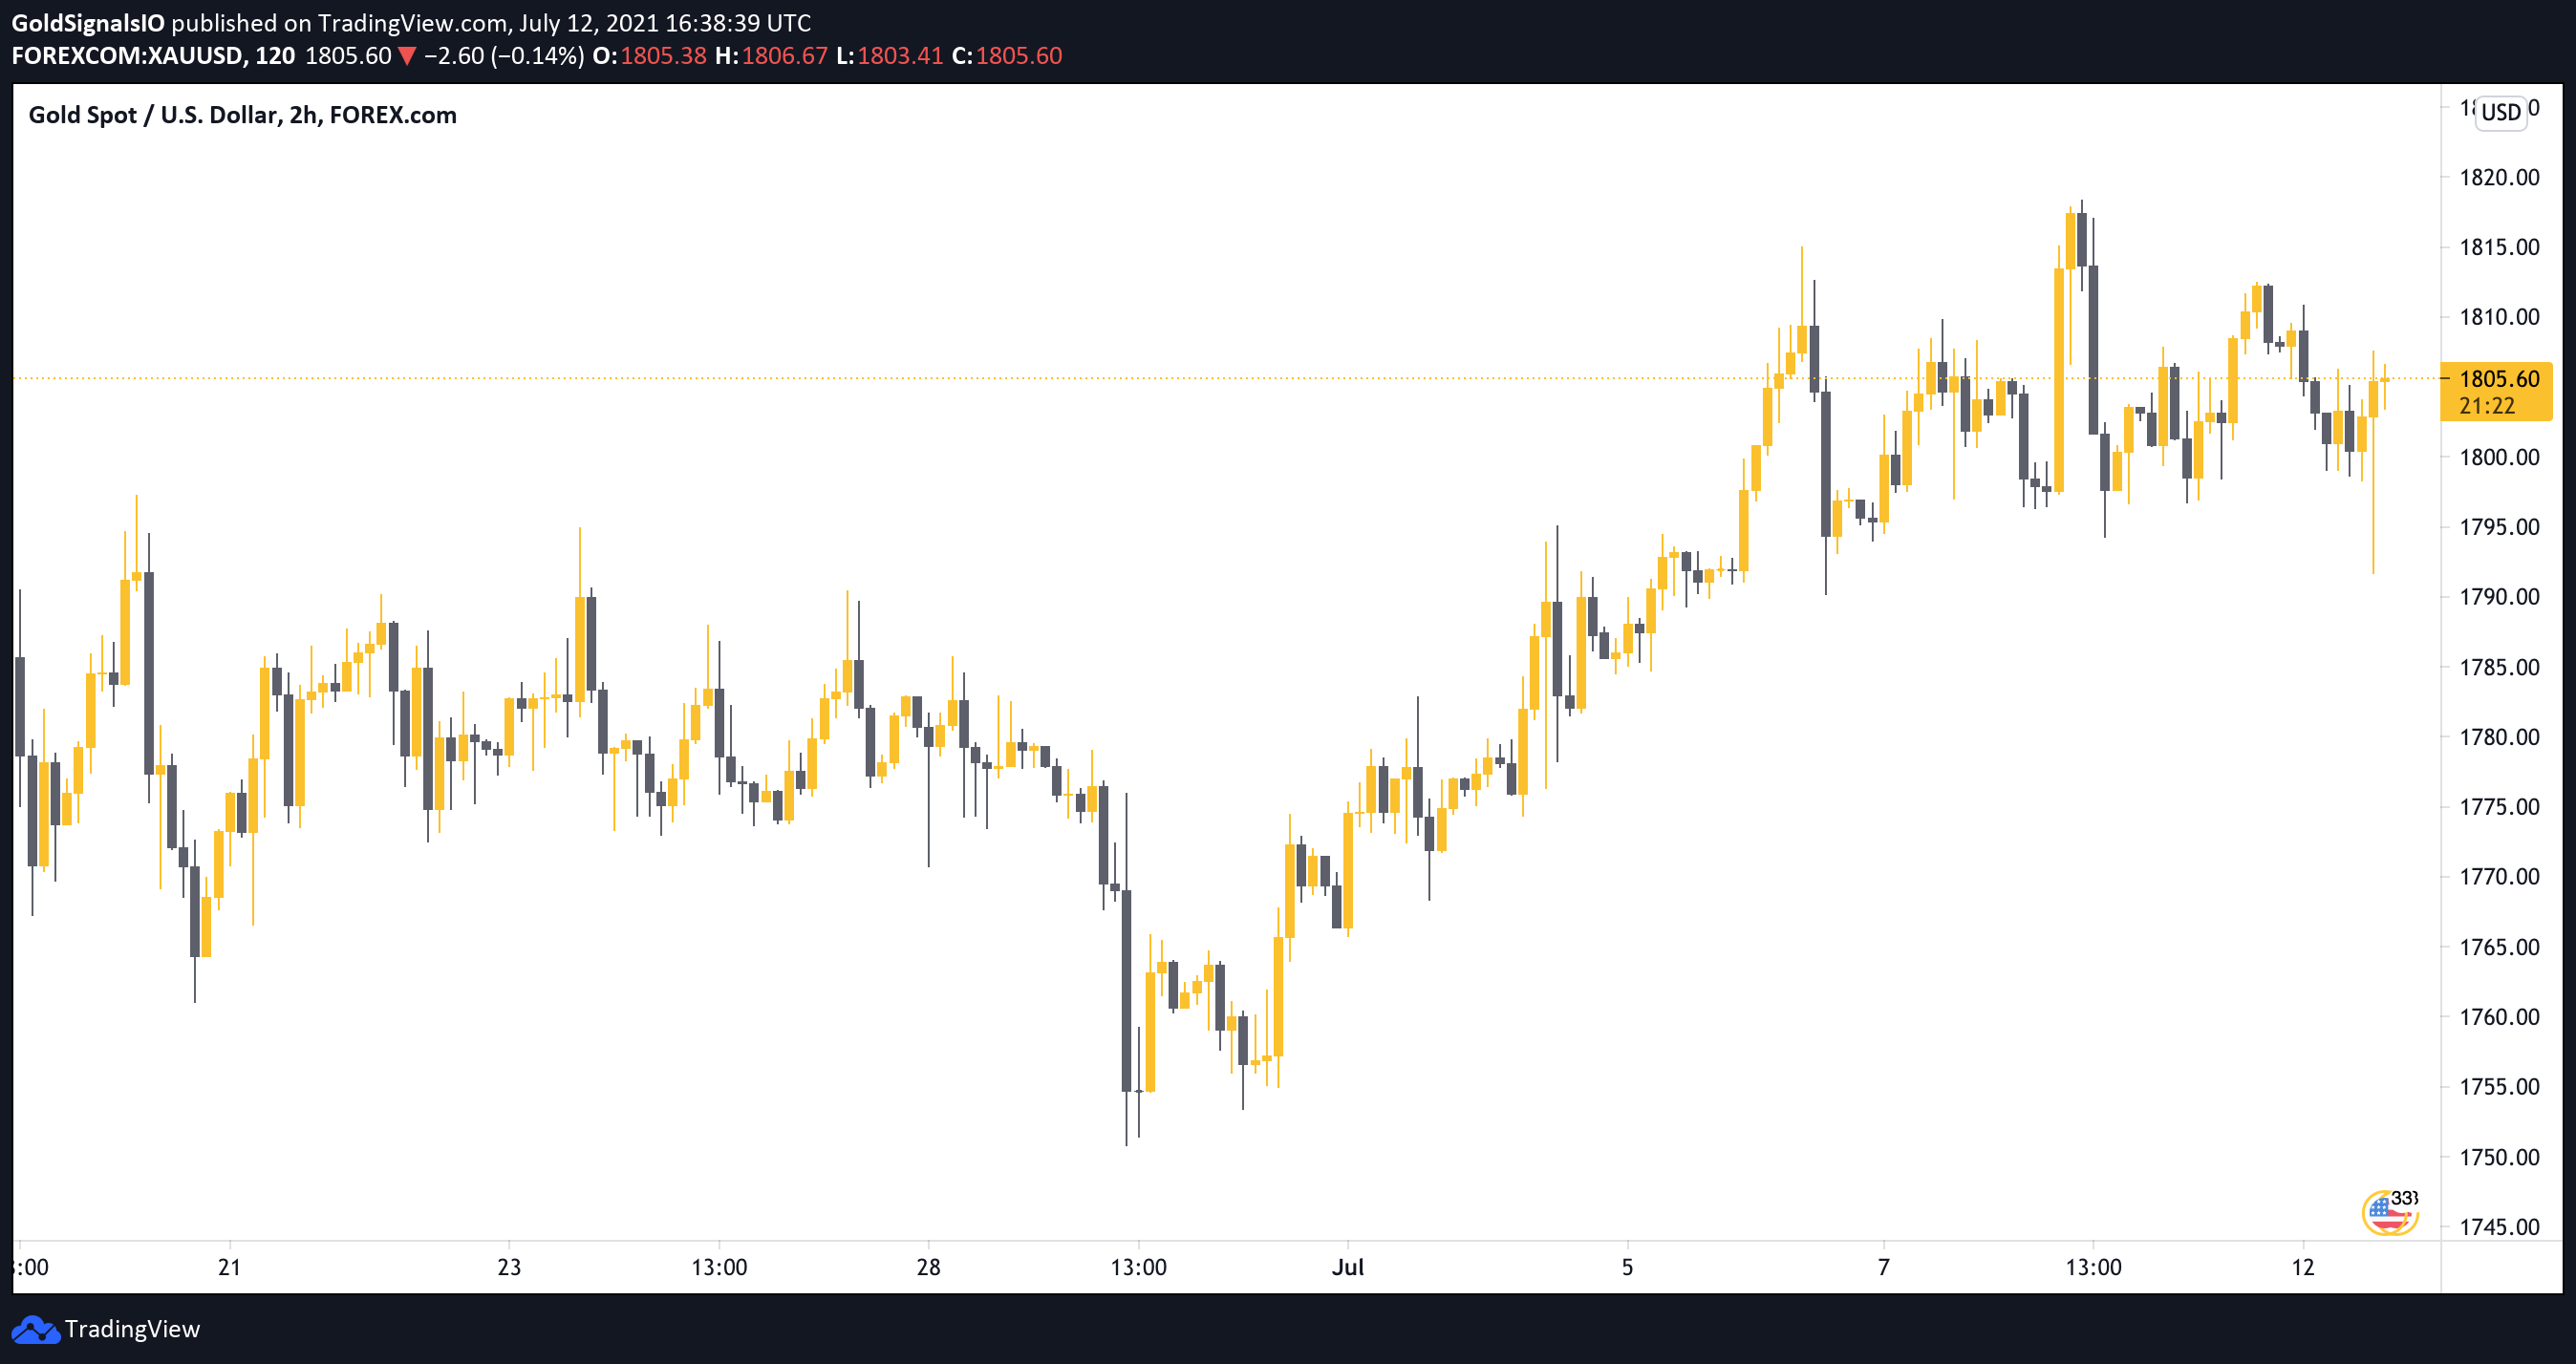
Using the right timeframe identifying price direction changes become much easier. Below is an example of a 2HR chart of XAUUSD as you can see there is no clear indication of directional changes in price.
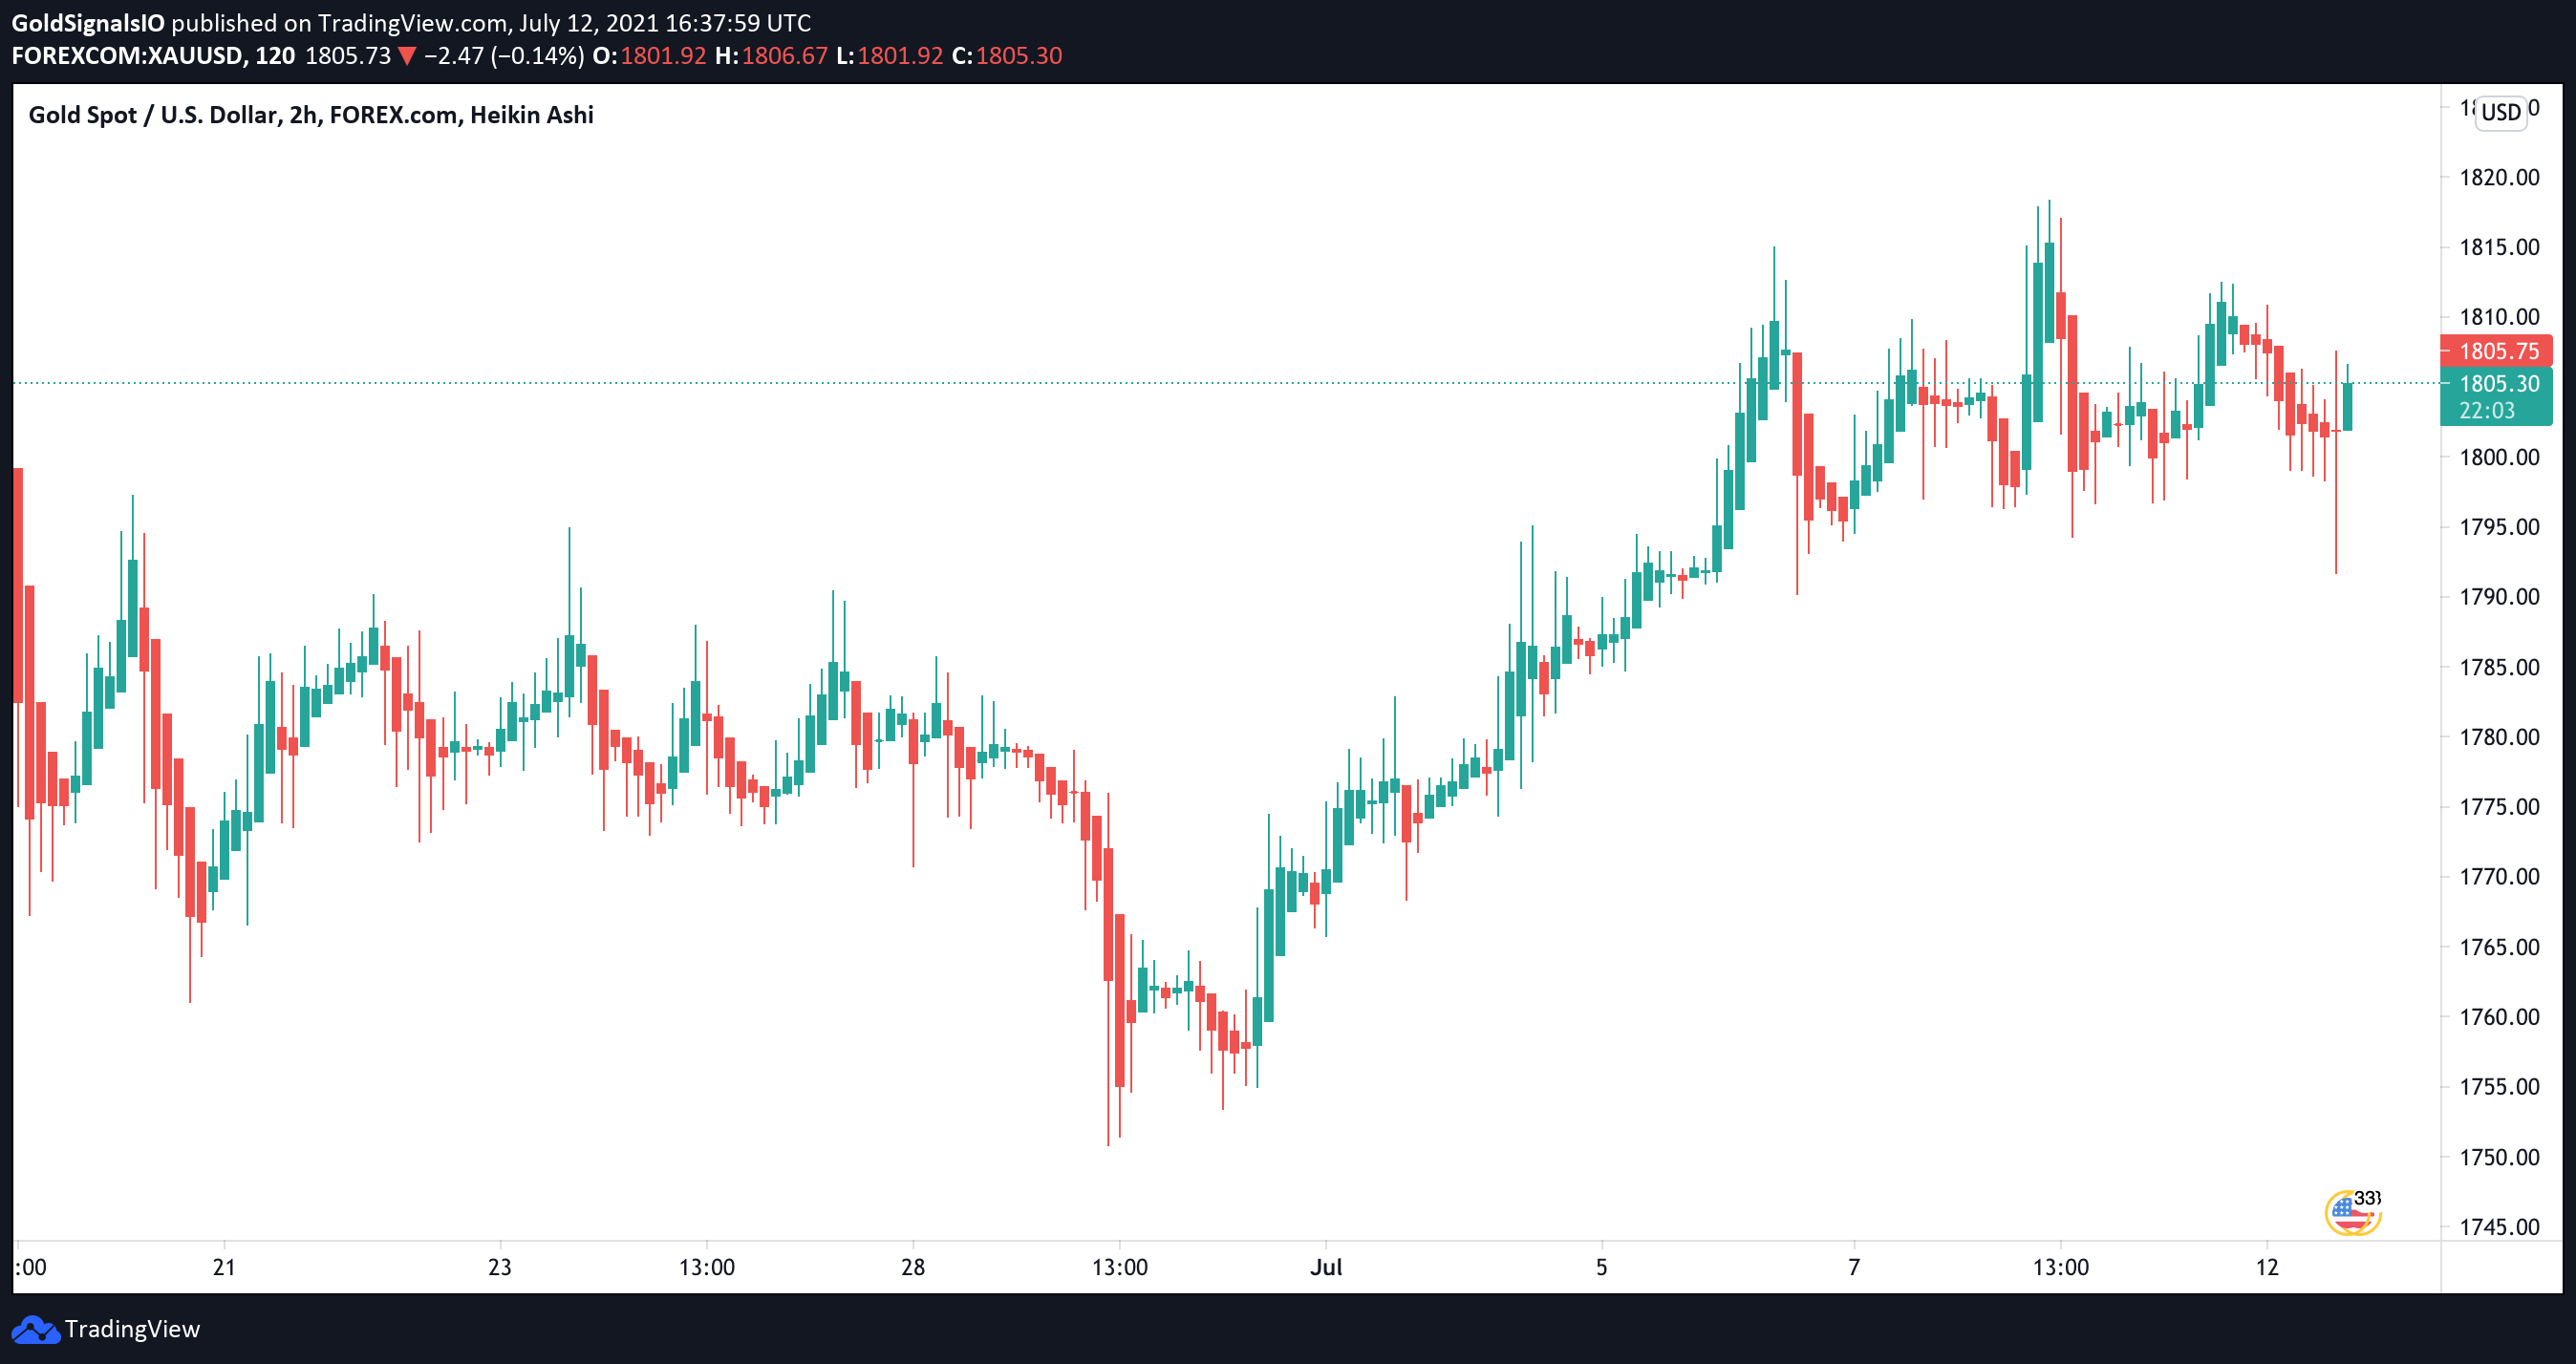
Now look below at the same period and timeframe 2HR Heiken Ashi, the waves of prices action are much much more visible. With large wicks signifying a direction change. This works well on gold as price ranges and the range itself is quite large.
Why doesn't everyone use Heikin Ashi?
Ther is a trade off, for a clearer indication of trend and momentum we lose the granular information about price, there is a trade off. The open and close of the Heiken Ashi is not the closing or opening price price of the period rather it is formulated to give us an average.
Open = [(Open price of previous candle) + (Close price of previous candle)] / 2
Close = (Open + High + Low + Close) / 4
So while Heiken Ashi can tell us about trends, it is not suitable for precise entries. It should be used as a confluence to an already existing strategy and is one (but powerful) tool of many in a traders toolbox.
- Adrian